
As we start to put the COVID Pandemic behind us, many of us are still wondering what lasting effects the pandemic will have on our lives, our families, our businesses, and our global economy. Over recent months, Brett Davis, President and CEO of National Indoor RV Centers, has received a great number of calls, texts, and emails from concerned RV owners who are concerned about the state of the RV Market, as well as our economy.
Below is a transcript of his response and here is a link to the full video explanation.
Greetings National Indoor RV Centers family of friends and customers,
My name is Brett Davis. I’ve been an avid RVer since purchasing my first coach in 1985, and full timing in my coach since 2013. I’m also President and CEO of both the investment firm Global Financial Services, as well as National Indoor RV Centers.
These are certainly interesting times we’ve been living through these past 16 months. Back at the beginning of the Pandemic, a little over a year ago, I made a video in an attempt to answer the myriad of questions I was receiving on a daily basis from our both our employees, and our customers.
I now find myself in the “same boat” again, so I am once again sharing my thoughts in a video. I realize many will disagree, but I hope you understand I’m merely trying to address the same questions I’m repeatedly being asked in this single sitting. While to most of you these are merely my thoughts, for me I do “eat my own cooking” in both my investment company, and National Indoor RV Centers by “putting my money where my mouth is“ on daily basis as we manage our capital.
I’ll discuss the current market conditions for motorhomes, what brought us to where we are, and then look out over the dashboard at what the future looks like to me. Are we headed back to the days of high inflation, or are we headed for deflation? As well as what opportunities may arise.
Some of you may remember me making the following statement in the video I recorded for our employees and customers at the beginning of the Pandemic in April of 2020:
Just like post 9/11, I think it’s very probable the motorhome industry is going to see another boom, only this time it could be on steroids.
As an investor I learned early on in my career to remain unemotional, and rely solely on the information. Let me take a minute to share some of the numbers behind my logic at the time, and what I was thinking when I made that statement. Along with what ultimately transpired, and brought us to where we are today.
When I recorded that video “stay at home orders” were in place, and businesses small, and large were shutdown, or shutting down. For the first time in our nation’s history our economy was shutdown, and we had no idea when America was going to open for business again. And, with every passing week of factory shutdowns, 350 Class A motorhomes weren’t going to be built.
Plus, when manufacturing did start back up, it was bound to be very slow due to the manufacturer of every motorhome component having been shutdown as well. The tertiary suppliers wouldn’t be able to supply the secondary suppliers, who in turn wouldn’t be able to supply the primary suppliers, who in turn wouldn’t be able to supply the Original Equipment Manufacturers, or in other words, the manufacturers of motorhomes. In short, there was going to be a severe shortage of everything!
COVID’s Psychological Impacts on an Entire Generation
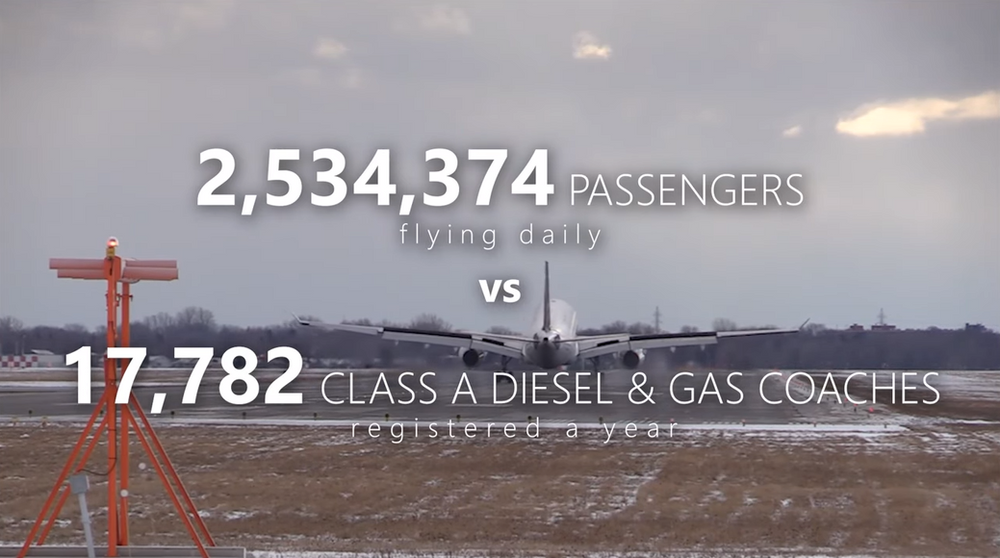
I also felt the psychological impacts of the Pandemic would end up scarring an entire generation, and change the way we looked at recreating. For example, according to the FAA an average of 2,534,374 passengers flew in and out of U.S. airports every single day in 2019 for leisure, or personal reasons. For some perspective, there’s a little over 10 million total registered RVs in the United States, which includes all motorized and towable units combined. Annually, 6,370 of those RVs were new Class A diesel coaches, plus another 11,412 new Class A gas coaches. As you can see, there are far more personal airline passengers in a single day than there are total Class A Diesel and Gas coaches registered in the United States. And, only 4 days of personal airline passengers exceeds the total number of all registered RVs in the United States.
I certainly didn’t believe the RV industry would cannibalize the airline industry. However, I did feel any drop in personal air travel passengers, no matter how small, in favor of RV travel would be huge to the RV industry, and lost in the rounding to the airline industry. For me, numbers always tell the story. TSA security checks on April 23, 2019, the year before the Pandemic, were 2,521,897 passengers. Remember, airlines were one of the very few businesses who never shut down.
Yet, one year later on April 23, 2020, the day I shot the video last year, security checks were only 123,464 passengers. A stunning 95.1% decline! Or, put another way, airlines only had 4.9% of the revenue they had the year prior to operate on. That’s what I think scarring an entire generation looks like. Unfortunately, hotel occupancies, and rental car agencies didn’t fair much better. Just as a point of interest, TSA security checks this past April 23, 2021 were 1,521,393. Still down 39.7% from the same day in 2019, despite having a vaccine.
Bottom line, because I believed there would be significantly fewer motorhomes manufactured, coupled with the psychological impact of the Pandemic, I could only see the demand for motorhomes skyrocketing. And yes, I did put my money where my mouth was by not cancelling a single order, plus purchasing every order any other dealer cancelled.
Today we have the benefit of hindsight, and let’s take a minute to see how things actually unfolded to create the supply and demand imbalance of the current RV market.
Supply & Demand in the RV Market
As a result of the shutdowns, supply chain, and labor disruptions, according to the RVIA new Class A motorhome shipments of both diesel and gas coaches fell from 16,420 units in 2019 to just 11,892 units in 2020. A drop of 27.6%, or 4,528 diesel and gas Class A units. When you take 27.6% of the supply out of the market in a single year, you would expect the demand for coaches to go up. Even without the psychological impact of COVID.
For example, if the market demand for coaches in 2020 was still at least the 16,420 units it was in 2019, today it would require and increase of 38.12% from the 2020 level of 11,892 units just to get back up to the 16,420 units manufactured in 2019. Or, put another way, the 27.6% shortfall in new coaches manufactured in 2020 has increased demand by 38.12%, before adding the psychological demand COVID created.
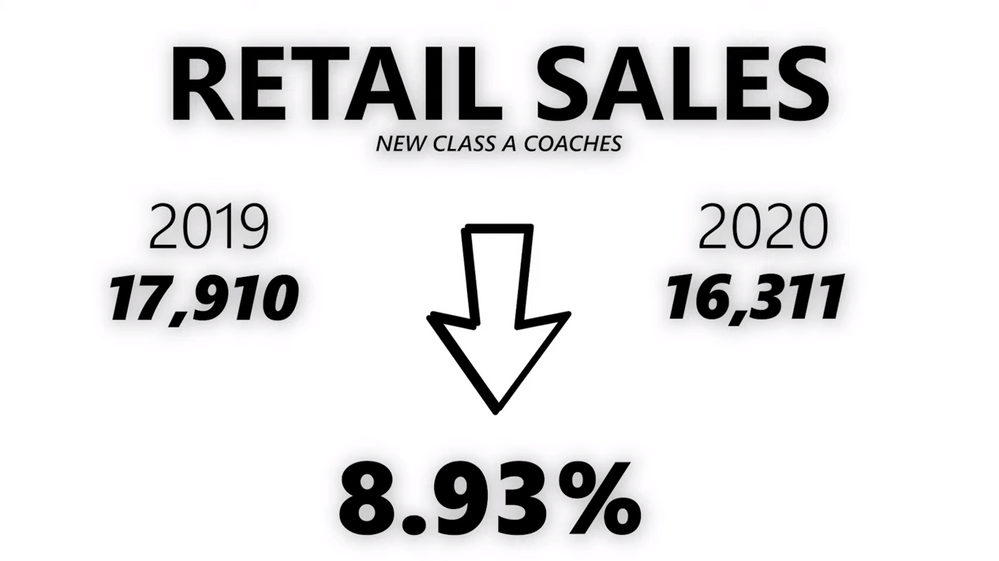
Now, I’ll shift gears from the number of new coaches manufactured in 2020 to the actual number of new coaches sold. Retail sales of new Class A coaches fell 8.93% from 17,910 coaches in 2019 to 16,311 coaches in 2020. However, the 16,311 new Class A coaches sold was still 4,419 more than the 11,892 coaches actually built. Where did those 4,419 coaches come from? Those coaches came straight out of dealer’s inventories, which explains why dealers haven’t had any new units in stock on their lots. Or, put another way, the 18.67% difference between the 27.6% decline in new coaches built in 2020, and the 8.93% decline in total new Class A coaches sold, came right out of dealer’s inventories.
Now, what about the remaining 8.93% decline in retail sales? Since there was no new coach supply left, what did those buyers do? Well, they purchased used coaches. They purchased used coaches with such fervor it has created a market dislocation, an arbitrage (the nearly simultaneous buying of a new coach, and selling of a used coach to take advantage of price discrepancies) if you will between used coach values versus the price of new coaches, the likes of which I’ve never seen in my 36 years of RVing. Like in all markets, notwithstanding how strange our current market is, there will still be an opportunity for some. However, before I discuss the opportunity, let’s talk about some market truths.
4 KEY MARKET TRUTHS:
- First, markets are like gravity, and no one can defy gravity! Unfortunately, I paid a lot of tuition early in my investment career learning this truth, but every time I’ve let my ego, or my emotions rule my decision making, gravity always won, and I lost money. Just as C.S. Lewis famously said “experience is a brutal teacher, but you learn, by God, you learn.”
- Second, markets peak when everyone thinks they’re going higher. Now we can certainly all make our own judgment on where we think the current prices for used coaches are versus their history. Personally, I’m betting we’re much closer to the top than we are to the bottom. However, even in a year of allocations by some manufacturers, I’m guessing we’ll still see model year 2022 inventory on some dealer’s lots long after the 2023 models have landed.
- Which brings me to the third truth I’ve learned about markets, and I’m sure we’ve all heard it before, and it is “pigs get fat, and hogs get slaughtered.” In every market, to varying degrees, there will always be an over supply, or under supply, resulting in strong or weak demand, but there is rarely perfect equilibrium, and if there is, it’s only momentarily. Most of the time it’s either a buyers market, or a sellers market. The key is to know whether you should be the buyer, or the seller.
- Lastly, as an investor of 42 years I’ve learned dumb money ceases to be dumb when it know it’s limitations. Information is always king!

Coaches are Not an Investment, They’re a Lifestyle:
As coach owners, I suspect we can all agree on a couple of things. One is, the RVing industry has thrived because we as RVers love the lifestyle, and certainly not because we love the experiences of buying, selling, or getting our coaches serviced. I also believe we can all agree we’re going to lose money on every single coach we purchase. Coaches are not investments. They’re a lifestyle.
So, what should our objective be when it comes to purchasing a coach? For me, it’s always been “bang for the buck!” I’ve always wanted to lose as little as possible, while still living the lifestyle in as nice of coach as possible. And, in my opinion, it all starts with not falling prey to the industry’s use of “smoke and mirrors.”

Every manufacturer has a different markup from invoice to MSRP, and every model has a different markup from invoice to MSRP within the same manufacturer. And, just as the industry’s marketing departments intended, this makes comparing discounts from MSRP between manufacturers, as well as between models within the same manufacturer, a fool’s errand when shopping for a new coach. And, consumers fall prey to this more often than not. Markups from invoice to MSRP range from less than 20% to as much as 60%, depending on the manufacturer, and the model. That’s a huge range! And, it makes for a lot stupid financial, and value mistakes at the purchase, just as the industry intended. Hence… “smoke and mirrors.” Boy, you’d sure better know, and trust your dealer!
The Best Way to Compare Coach Values: Cost of Ownership
In my opinion, the only number we should be using for comparative values when shopping for a new coach is the annual cost of ownership, or depreciation if you will. How much money will it cost me per year to live in this coach versus that coach? That’s the number we should be comparing between coaches.
And, there are really only three things which determine how much the annual depreciation cost will be when purchasing a new coach, and they are:
- How much did your dealer make off of you upfront?
- Are you buying a quality manufacturer? Remember, a new Book Value comes out every 60 days, so lower quality coaches start depreciating faster right from the git-go.
- And finally, the biggest factor of all, what will the coach sell for in the used market four or five years from now.
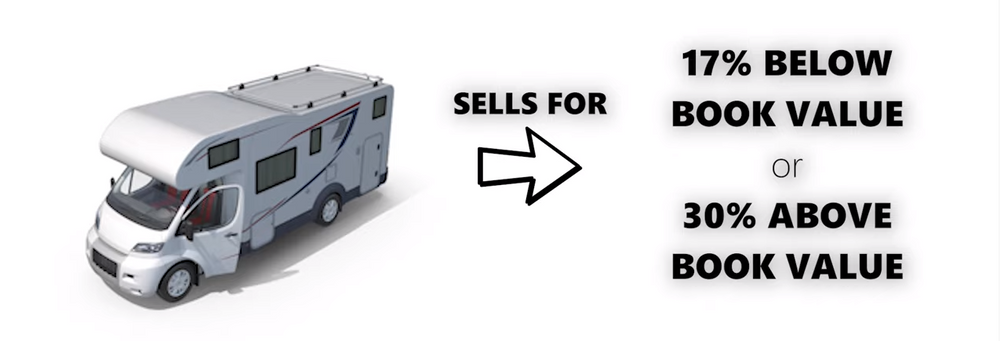
Let’s take a closer look at this for a minute. Every manufacturer, every model, and every floor plan, sells in the used market at varying premiums, or discounts to Book Value. Again, the range is huge! If the manufacturer is no longer in business, their coaches sell at 30%, or more below Book Value. So, when a salesman is telling you “this is a steal of a deal at 10% below Book,” and “I can’t believe my Sales Manager is agreeing to let this go for this price, you could immediately resell this coach for Book value, and make a profit”… you should RUN!!!
Now, for active manufacturers the discount to Book Value in the used market ranges from 17% below Book Value to a premium of over 30% above Book Value. When you apply a swing of that magnitude to the sales price of a used coach, you can quickly see why what your coach will sell for in the used market, has the single biggest impact on your cost of ownership.
Now for those of you who currently own a coach, and are considering to upgrade, I’ll say I’ve never seen a better time to do so in my 36 years of RVing. Now, please allow me to explain why I’ve been making that statement since last summer.
Never a Better Time to Upgrade
Thanks to COVID shutdowns, followed by continuing supply chain disruptions, we’re now seeing some unprecedented events, including my aforementioned arbitrage which heretofore, has never been seen in the coach market.
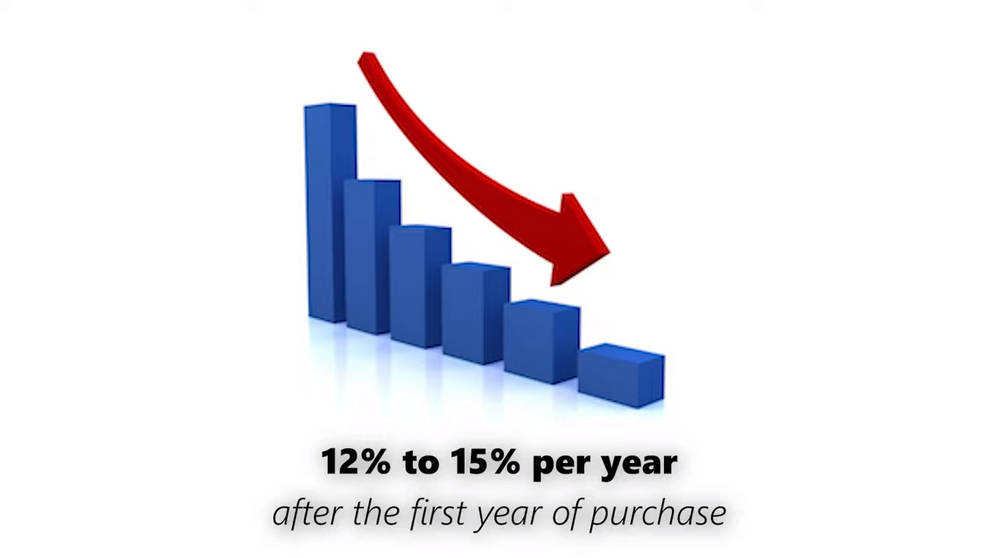
For starters, the past six Book changes, that’s an entire year, Book Values have gone up every single change for all six changes! That’s unheard of on an asset whose Book Value has historically declined between 12% to 15% per year, after the first year of purchase.
Secondly, due to a severe shortage of coaches, demand has caused more than a 50% increase in the historical premiums of used coaches over Book Value.
Those are two very unprecedented tail winds! Yet, the price increases from manufacturers on new coaches, within the same model year, are averaging about 4%. Personally, I don’t ever recall seeing that arbitrage, and certainly nowhere near current levels. We’ve all heard people authoritatively state they’re “going to purchase a used coach, and let someone else take the depreciation hit on the new coach.”
I’d argue the fallacy of that statement when it comes to coaches, as opposed to automobiles, in any market, but I’ll save it for another time. However, there’s certainly no denying it’s fallacy in the current market. Bottom line, after six consecutive increases in Book Value, an entire year, plus a 50% increase in the margin used coaches have been selling for relative to their Book Value, I have certainly never seen a better time for a current coach owner to upgrade.
Let’s break this down a little with an example using real numbers. Out of all the makes and models we sell, I’m going to use the Entegra Anthem in my example. I assure you, “I do love all my children equally.” I could have used any make, or model in my example to illustrate the current arbitrage, obviously the numbers would be different, but the outcome would be much the same.
First, during normal times a 2018 Anthem’s Book Value would have decreased 12% to 15% per year. Let’s be conservative, and assume the lower end. Over the past year a 2018 Anthem should have gone down at least 12% in value over those 6 Book changes, but instead it has gone up 8.09%. That’s a 20.09% delta alone!
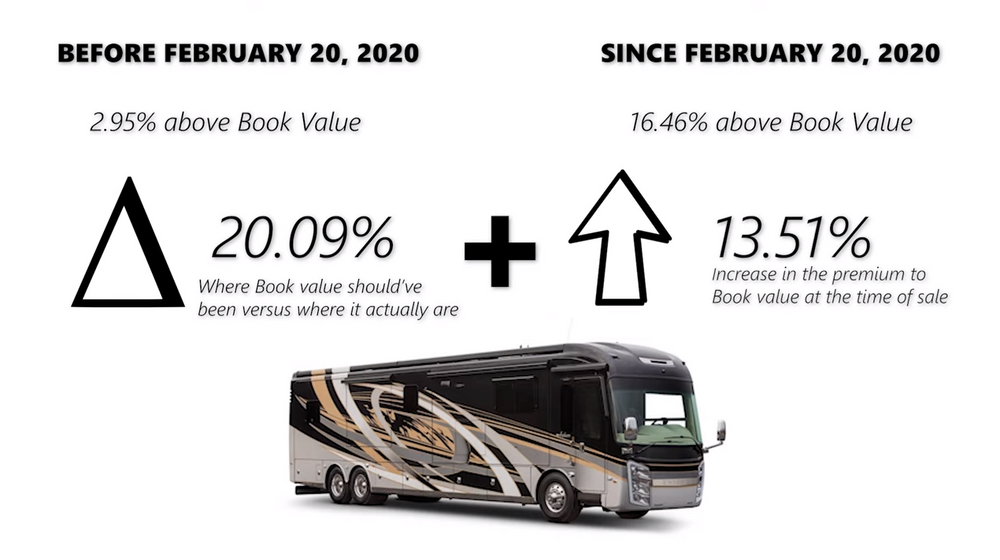
Secondly, now add the whopping increase in the historical margin to Book Value, and it’s eye popping. Before the pandemic, and I’m using a cutoff date of February 20, 2020, Anthems sold in the used market at 2.95% above Book value. Since February 20, 2020, Anthems have sold at a blistering 16.46% above Book value!
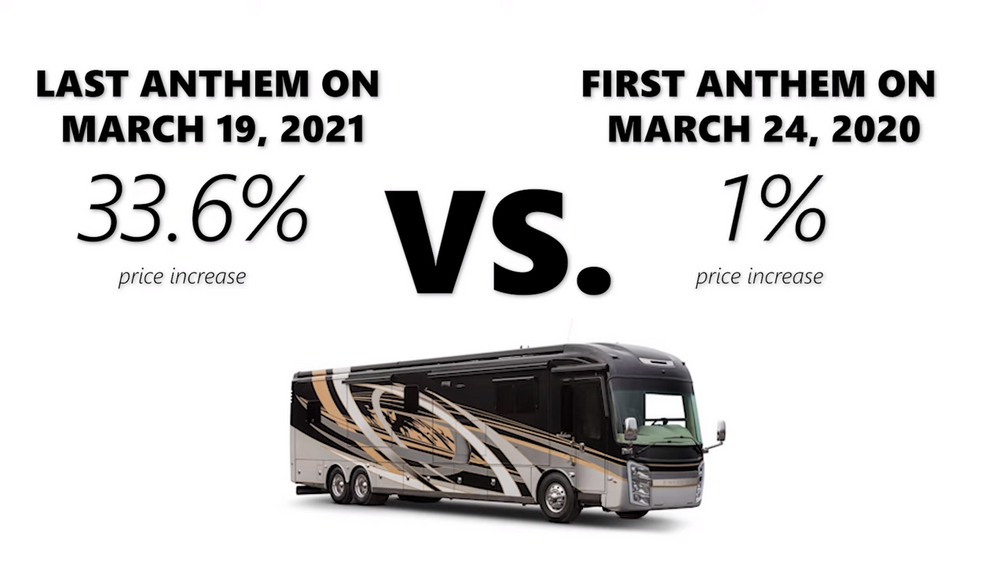
Now, adding together the 20.09% delta between where Book value should be versus where it actually is, plus the 13.51% increase in the premium to Book value at the time of sale, you get a whopping 33.6% versus the almost 1% price increase from the invoice of our very first new 2021 Anthem on March 24, 2020 to the invoice of our very last Anthem on March 19,2021.
Hopefully, you can see why this is a really unique time to upgrade. A 33.6% inflated value on your coach in the used market when compared to historical depreciation of 12% in the best of years, equates to 2.8 years, or almost 34 months of depreciation. To put an exclamation point on how bizarre the used market has gotten due to unprecedented demand, according to the University of Michigan the mean length of time someone owns a coach is 4.3 years, or 51.6 months.
The seller of a used coach today is not incurring the cost of 34 months worth of depreciation on a coach the next owner will statistically only own for 51 months! Again, what goes up must come down. No one can defy gravity. And, probably sooner than later, used coach values will come back down to earth. But, there’s little doubt we’re currently in a seller’s market if you have a coach to sell.
I want to point out, I’m recording this video close to a model year change over, and prices do always increase with each new model year. I intentionally used the beginning and ending Invoice prices of a new 2021 Anthem to capture the price increase on new coaches intra model year versus the price of coaches in the used market. I’m simply trying to present an “apples to apples” comparison.
Economic Growth & National Debt
Now, I’d also like to quickly point out one more confirming data point by looking back again to my video from last year:
We commissioned a study back when we were deciding whether to get into sales or not. The study was to determine if there was a correlation between the sale of motorhomes and a number of variables including interest rates, fuel prices, income levels, personal net worth, personal savings, inflation, employment rates, population by age and many more. We had over 20 variables and what we discovered was there was no correlation whatsoever to anything other than the S&P 500, basically the stock market. And, the correlation between motorhomes and the S&P 500 was almost a perfect correlation. When people felt wealthy or secure, they purchased motorhomes; whether that wealth was in their retirement accounts or their current brokerage and savings accounts. When people didn’t feel wealthy, they didn’t purchase.
If the stock market is a barometer for motorhome sales, what does the S&P 500 look like right now?
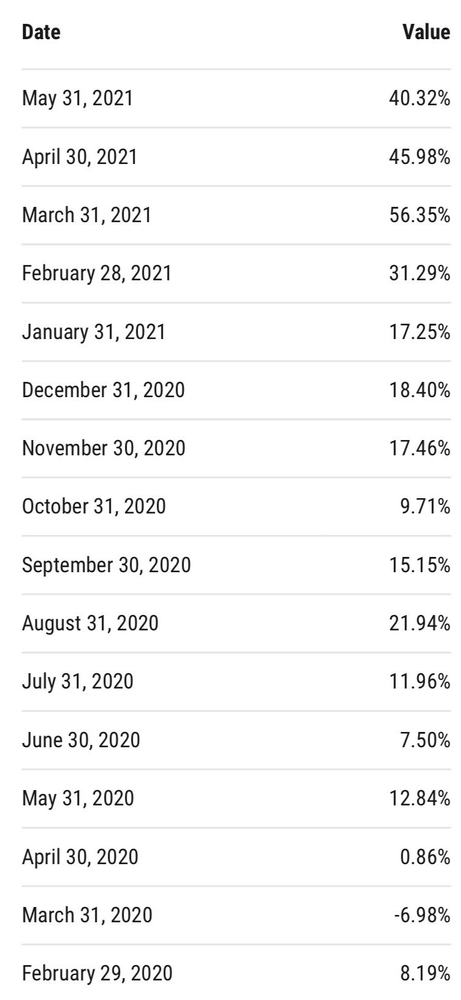
Well, for the trailing 12 months ended May 31, 2021, the total return for the S&P 500 was 40.32% versus it’s long term average of 8.35% (see the below graph). Clearly, both the RV, and Stock markets are trading at multiples of their long term averages. And, as the supply chain returns to normal in the coming months, manufacturers production of new coaches will increase, supply and demand will come back into balance, and this arbitrage will disappear.
Total Return for the S&P 500 for the trailing 12 months by month:
Moving on, there isn’t a day go by where I’m not being asked in an email, text, phone call, or at one of our Rallies for my thoughts on our economy, or our national debt, or concerns over inflation because of the significant price increases we’re seeing across all commodities, services, and some products. With two new buildings about to come out of the ground, believe me, we are keenly aware of the increases in the costs of construction here at National Indoor RV Centers. However, after stepping back, taking a deep breath, trying to set my emotions aside, and do my very best to think logically, here are my thoughts.
For me, most who are forecasting large scale economic factors such as interest rates, inflation rates, National productivity, and the like, seem to be too politicized. And, I don’t mean in a partisan sense, although it may be so. I feel the bigger problem is most forecasters spend their time thinking about decisions by the Central Bank and government policies. Over the long haul, I just don’t believe those are the most important factors. Not even close.
Over the long haul what has always driven economic progress is our ingenuity, and the innovation it produces. In other words, technology. And, I don’t mean electronics. I’m using technology in its broadest terms of applying knowledge to make our lives better. From the invention of the wheel, to planes, trains, cars, radio, television, computers, plus thousands more, each one has boosted economic growth, and their cumulative effect has brought us to where we are today.
Rarely, if ever, have governments and central banks invented any technologies. It’s just not what they do. At their very best, they can establish conditions which will unleash talent. At their worst, they suppress talent. The entrepreneurial spirit if you will.
There are lots of other forms of innovation which have improved our lives such as Dominos pizza delivery, Uber, AirBNB, Walmart, and thousands of other businesses, all focused on making our lives a little easier in small ways. Their cumulative impacts have created a society people living a century ago couldn’t even fathom.
Our mission here at National Indoor RV Centers is to be one of those companies by doing all we can to remove the hassle from RVing. And, look for us to introduce some additional innovations we’ve been working on for the past couple of years in early 2022 which will do precisely that. Remove more of the hassle from RVing.
Moving on from economic growth over the long haul to the question of inflation, what’s causing it, and is it here to stay?
Personally, I expect more inflation in the near term, however, I’m far more concerned about deflation over the longer term.
Just as it has been in the motorhome market, a lack of supply has lead to increased demand, which in turn has lead to higher prices in some goods and services.
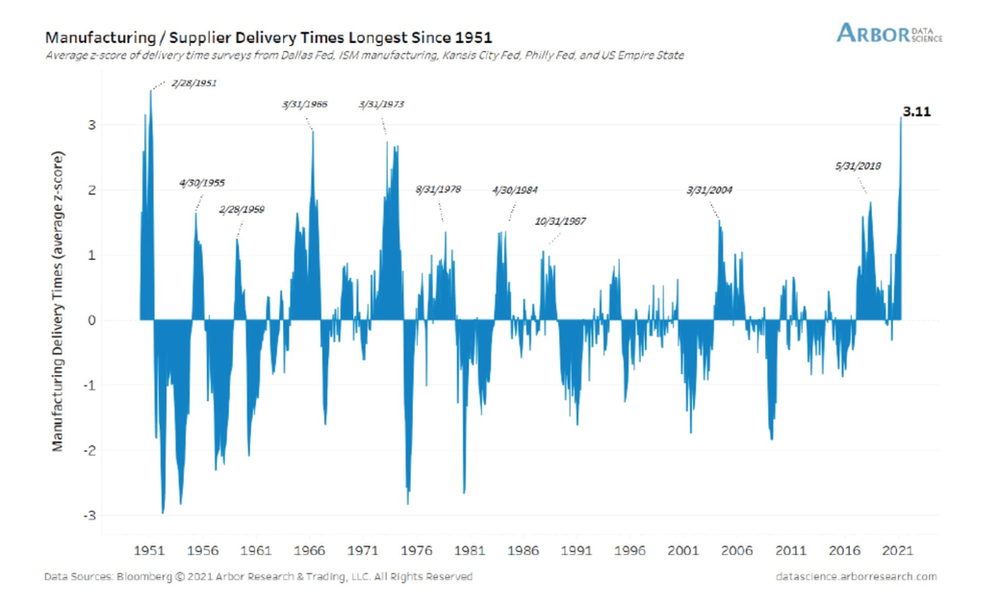
As you can see from the chart above, the index for manufacturing and supplier delivery times are at a 70 year high. Having to wait for an item, like five months for a motorhome while it’s being built, when you would once have easily found it on one of our lots, is itself a kind of inflation, even if the price is the same. You get less value, less use than you would have by taking it straight home. And, guess what? That’s happening everywhere right now, yet it doesn’t show up in the Consumer Price index, which index is how we measure inflation. However, prices are rising in raw materials, and price increases in finished goods are sure to follow.
Let’s look at it another way. The head of Intel said the semiconductor supply chain is going to be a problem for two years. So far, they’ve been rationing their product, but with deliveries at a 70 year high, I promise this won’t remain the status quo. However, there’s a very simple fix for the supply chain. Charge more money! And, that’s called inflation. We’ve all seen this film before. Price increases will slow demand, and give the supply chain time to catch up. Hence, I do see inflation in the short term, but I don’t see how it’s sustainable over the long term, and please let me explain why.
Deflation & the Global Debt
First, let’s talk about global debt. I’m using global debt instead of just our National debt, because I believe after living through this past year of the Pandemic, with all the shortages, and supply chain disruptions, we can all agree our economy is more global than we care to admit, or would like it to be. However, the story would be much the same if I used just our National debt.
Excessive debt suppresses economic growth, and without economic growth demand can’t rise enough to create inflation. This has become a structural problem, which at this point, I struggle to see how we’ll ever fix it.
How much debt is excessive? Think about it in terms of our personal lives. It’s really not the absolute dollar amount of debt we owe that determines if we have too much debt. There isn’t a rule that says anything over $100,000 of debt is excessive. No, we look at debt as it relates to our incomes, and our ability to pay the debt back out of what we earn. The same is true for nations. What is their debt as a percentage of their income, which we call Gross Domestic Product, or GDP.
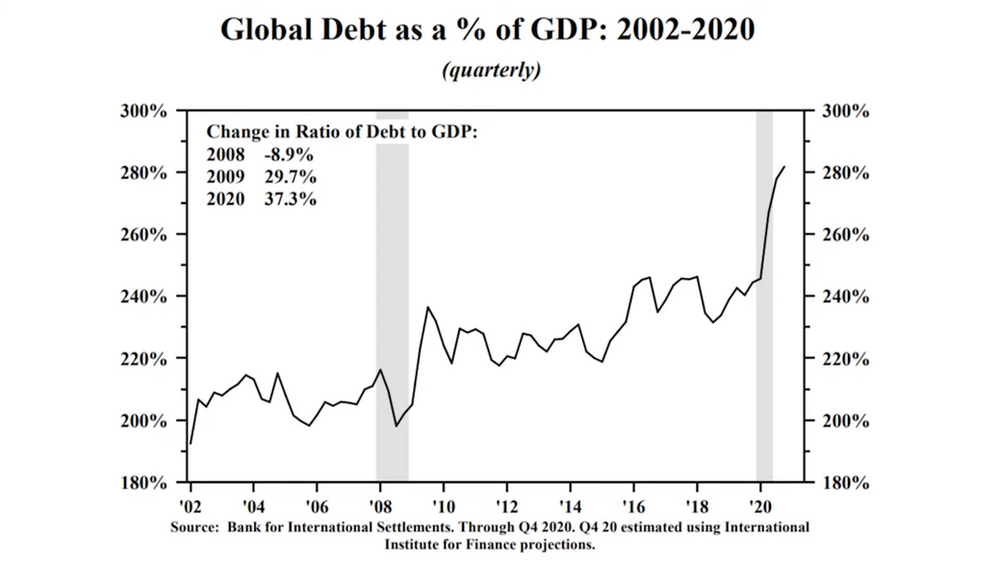
As we look at the above chart, is anyone surprised to find out debt is at an all time high as a percentage of GDP? In fact, if you look closely, the debt to GDP ratio is now 37.3% higher than it was during our last recession in 2008. Just so we can all relate to the magnitude we’re talking about, imagine in your personal life if your debt was almost three times larger than your gross income.
After you paid for all your necessities such as taxes, insurance, utilities, food, medical, and then your debt, your mortgage, your car, your credit cards, etc., there wouldn’t be much left over, if any, to entertain yourself with travel, or dining. Well, the same is true for nations. After they pay for their necessities, their militaries, social programs, medical programs, and on, and on, and on, then they have to make payments on their debt too, it just doesn’t leave much of the pie for the private sector, for business, for unleashing talent to innovate.
Remember earlier when I mentioned I believe economic growth over the long haul comes from innovation which makes our lives easier. And, since central banks, nor governments invent technology, or innovate, the best they could do is foster an environment where talent can flourish, and at their worst they thwart talent. Well, with this level of debt to GDP, I believe they are doing their worst, and thwarting talent, innovation, and real economic growth.
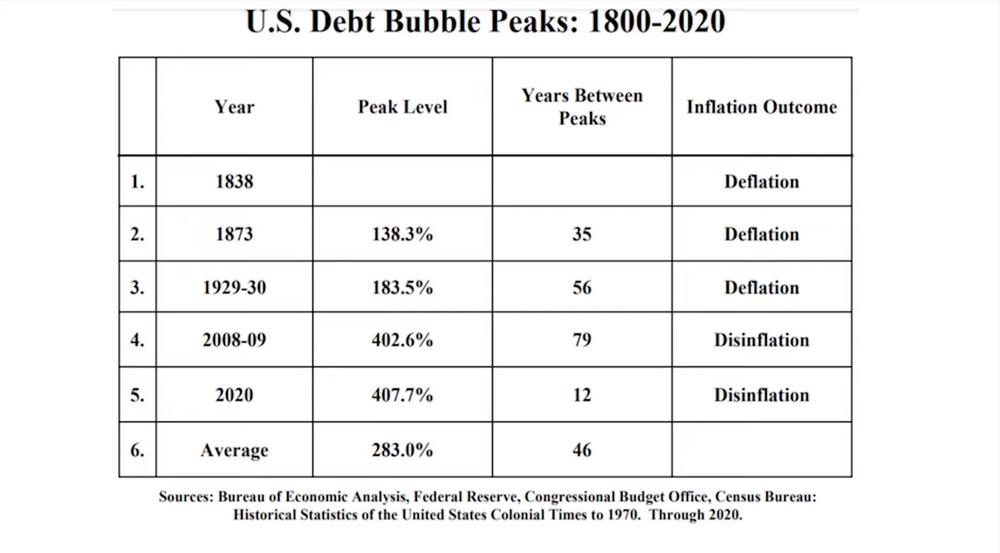
Next, let’s look at history, specifically the last two centuries, and here I will limit the debt to just our nation, because our economy hasn’t always been this globally dependent. From the chart above you can see the United States has had five debt bubble peaks, and all five of them were followed by deflation. We are currently in our sixth, and largest debt bubble peak, and if history is any indicator, we should see deflation again.
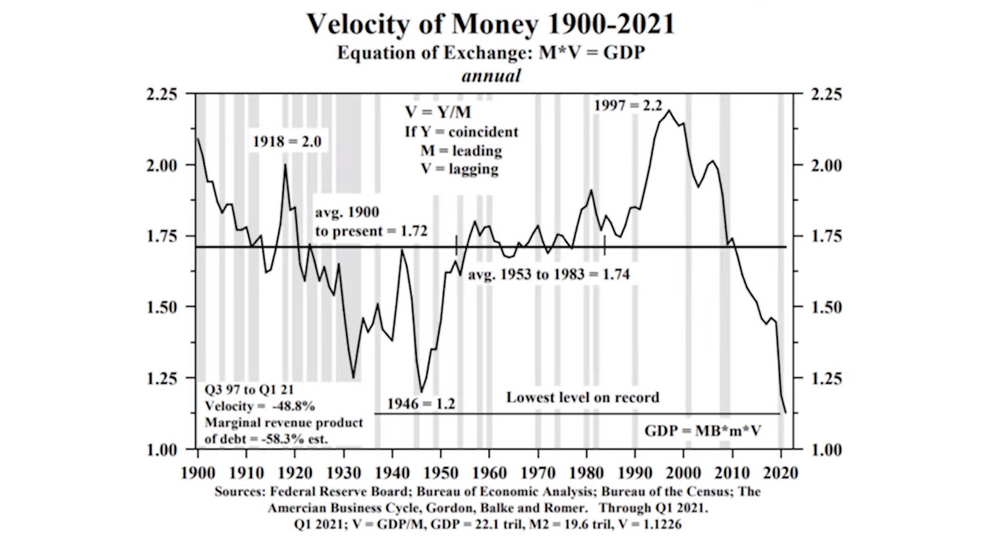
If all my talk about debt is troublesome, I find the speed with which our money circulates even more troublesome. In looking at this chart we can see the velocity of our money is at its lowest point ever!
Why is the velocity of money such a big deal? Every time you buy a product, or service, somebody is getting paid to produce, or provide that product, or service. They then in turn go out and buy something they want with what they just got paid. Every time this cycle happens it’s called a turnover of money. Someone bought something they wanted, and someone got paid, who then went out and bought something they wanted, and so on.
The “Turn Over of Money” & Why It’s Important
Now what happens if someone doesn’t go buy something? Or, what happens if someone receives their income without working? Well, the turnover of money slows.
Governments and individuals want our money to turnover as many times, and as quickly as possible. We want to see real velocity in the rate at which our money turns over. Why? Because every time our money turns over our government gets to tax that same dollar again. The more it turns over, the more taxes they can collect, and theoretically, the lower our taxes will be. But, when our money is turning over slowly, the less times our government has to tax that same dollar, and the higher they need to raise taxes to cover whatever our government feels needs to be covered. Bottom line, It’s in all our best interests for everyone to work producing, or providing something for someone to buy, and then in turn buying something with what we just earned.
You can’t look at what’s happened to the speed at which money turns over, and its velocity hitting an all time low without asking what’s causing it. From that above chart you can see the velocity of our money has been in a steep decline for the past 25 years, and it’s because we’re taking on too much debt, which is triggering diminishing returns at this point.
Bottom line, as long as excess debt is pushing the velocity of our money lower, demand will keep falling, and sustained, long term inflation is impossible under those conditions.

Summary
A quick recap of my thoughts, and they’re worth exactly what you’re paying for them. The Pandemic created a shortage of just about everything, which in turn created demand, which in turn is causing prices to increase, which is inflation. However, the supply chain will correct itself as more people come back to work, and as price increases slow demand. Ultimately, excessive debt will stymie innovation, demand, and the velocity of money, which is why I’m far more concerned about deflation in the long run than I am inflation.
But, for those of us who love the RVing lifestyle. Who love turning our country into their backyard, and who currently own a coach, there is a window to take advantage of a real aberration between between the cost of upgrading to a new coach versus the increase in value of used coaches.
To be clear, I’m not saying this is an investment opportunity. You will lose money on every coach you buy. It’s a lifestyle. This is just an opportunity to lose less. Plus, owning a depreciating asset during deflationary times isn’t the worst thing that can happen. It certainly certainly lessens the real cost of ownership compared to inflationary times.
If I just confused you with that statement, please let me try to explain. The “real” cost of anything, like with the “real” return on an investment, is always after factoring in inflation. “Real” returns, and “real” costs are a measure of what’s happening to our purchasing power after the effects of inflation, or deflation.
For example, if a coach depreciates 12% in a year where inflation is running 3%, the delta, or the “real” cost is 15%. Now, what if inflation was a negative 3%, or in other words, deflation of 3%, the delta would now be 9%, and thereby lessening the “real” cost of ownership by 6%.
I hope I’ve answered most of the questions many of you have been asking me, and if you didn’t ask, thank you for taking the time out of your life to listen to my musings. I hope I get the opportunity to see you again, or meet you down the road at one of our AIM Rallies. Until then, safe travels, and all the best!
Brett Davis