
Below is a transcript of his video and here is a link to the full video explanation.
Welcome National Indoor RV Center’s family of customers and friends to RVs, the Economy and You! UPDATE #2, Part Two.
In Part Two we’re going to discuss a little history, along with the following six topics:
1. Monetary Policy 1 (MP1)
2. Monetary Policy 2, or “Quantitative Easing” (MP2)
3. Monetary Policy 3, “Helicopter Money” (MP3)
4. Supply and Demand
5. Labor Force Participation (LFP)
6. Stock Market
Let’s discuss the three stages of monetary policy, starting with what’s referred to as Monetary Policy 1, or MP1.
For decades MP1 was the primary monetary policy. MP1 is the practice of modulating interest rates to affect the economy. For decades these changes in interest rates worked, because they impacted so many things. By reducing interest rates the Fed was able to stimulate the prices of financial assets, which led to more wealth-effect induced spending, it increased debt-fueled capital investment, and reduced borrowing costs. By increasing interest rates the Fed was able reduce demand, and reduce inflation.
For those of us who are old enough, I’m sure you’ll remember our nation’s rate of inflation during the 1970s, and early 1980s. Inflation peaked at 14%, the Prime Interest Rate hit 21.5%, and the unemployment rate reached 10.8%.
The Federal Reserve, lead by Chairman Paul Volcker, raised the Discount Rate, the rate banks could borrow from the Fed to 14%, and raised the Fed Funds Rate, the overnight rate banks lend to each other, to a whopping 20%! Think about that for a minute. If you’re a bank, and have the opportunity to lend your money overnight at no risk, and earn 20% per annum, what interest rate would you need to earn on a loan in order to entice you to take on the risk of the loan? 23%? 24%? 25%? Clearly, lending ground almost to a halt, which thwarted demand, and the rate of inflation came down fast, dropping to 3% by 1983.
Bottom line, under MP1, interest rates were the driver used to change the levels of borrowing, and lending in order to alter spending habits. If you remember, we used to see 3 to 5 percent interest rate changes in order to move our economy. But, when short-term interest rates near zero, as they did following the 2008 Financial Crisis, MP1’s effectiveness was greatly reduced. Enter Monetary Policy 2, or MP2, or Quantitative Easing, or QE for short.
During the Great Recession our economy was very weak, inflation was reasonably low at 3.84%, and interest rates, specifically the Fed Funds rate, were approaching zero, as it stood at 0.09%. Our country was in a financial crisis! There was no room for the Fed to lower interest rates to stimulate our economy. They were already near zero! Credit had completely dried up. The government sponsored mortgage enterprises FNMA and FHLMC we’re taken over by the government, money markets were “breaking the buck,” ships weren’t docking to unload their cargo, because our global trading partners didn’t trust our bank’s Letters of Credit guaranteeing payment for their goods, and I could go on, and on. The Fed needed to stimulate credit, and stat! The Fed responded by purchasing long term treasury bonds, and non-treasury securities ranging from mortgage backed securities, commercial paper, plus a plethora of other types and classes of securities. The Fed’s change in policy from purchasing only treasury securities during its Open Market Operations, to purchasing all types of securities, and in never before seen amounts, was called Quantitative Easing. And, Quantitative Easing has continued unabated since the Financial crisis of 2008 to today. They’ve never stopped purchasing large amounts of securities.
With the Fed having been so accommodative under both Monetary Policy 1, and Monetary Policy 2 since the Great Recession, you might be wondering, why didn’t we see inflation?
Well, we did. We’ve seen a lot of inflation in assets. Think of the tremendous gains in the Stock Market, the prices of homes, and real estate. But, none of us complained about our assets increasing in value. And then, suddenly, the Pandemic hit, and ushered in Monetary Policy 3, or MP3, or more commonly referred to as “Helicopter Money.”
When the Pandemic hit the Fed had already tapped out MP1. Interest rates were already near zero. Again. The Fed Funds Rate on March 15, 2020 was 0.25%. Likewise, when it comes to MP2, the Fed had never stopped purchasing assets. The Fed wasn’t fighting inflation which stood at 2.5% in March of 2020. The Fed wasn’t dealing with a crisis of credit this go around. Working in concert our government and the Fed needed to create demand in order to avert mass poverty.
The mechanics of combined monetary stimulus from the Fed, and fiscal stimulus from Congress, was inherently inflationary. MP3 created demand without creating any supply. “Helicopter Money” more than made up for the incomes lost to widespread shutdowns without making up for the supply those incomes had been producing. The Federal Government put $6 trillion dollars directly into the hands of consumers, much of it regardless of need. Remember the Paycheck Protection Program, unemployment checks, stimulus checks, and the list goes on. While at the exact same time state and local governments restricted many retail and servcie businesses from opening. Unable to spend on services, and experiences, we sat at home with with all the stimulus in our pockets, along with some of the lowest interest rates in history, and we bought STUFF! We demanded more goods than our logistical infrastructure had ever produced or delivered. 15% more!
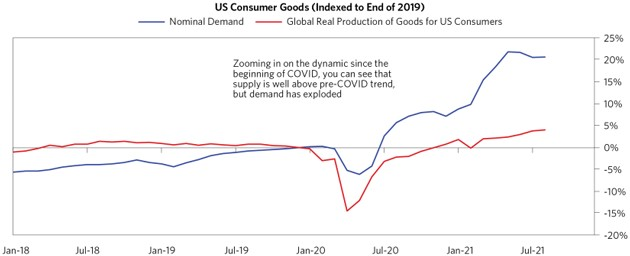
Voila, supply shortages. Throw in supply chain problems, and we have inflation in goods. Demand for services hasn’t fully recovered, but it’s sure headed that way fast!
All the government stimulus has put cash in our pockets, and Quantitative Easing has raised asset values. Interest rates are low. However, one consequence of inflation is it pushed “real” interest rates lower. Depending on which benchmark you use, short-term interest rates are now hovering around -6%. If the Fed follows their recent practice, and raises rates 1/4% at each of their meetings starting mid-year June, it might add up to a 1.25% interest rate hike by the end of the year. If inflation continues, it will still leave us with negative real interest rates of -3%, which is still incredibly accommodative. This is the box the Fed is currently in. They will have to stop Quantitative Easing, and raise the Fed Funds rate 3%, or more just to get real interest rates to 0%. I suspect if the Fed were to really do this, we would see a financial temper-tantrum on steroids.
I’d like to point out, raising interest rates will have real consequences. Clearly, higher interest rates would raise borrowing costs for the biggest borrower of all, the US Treasury. Our nation’s debt has reached such a size, even tiny interest rate increases add very large dollars to our budget deficit, and debt. And, no one goes unscathed. Think of all the adjustable rate mortgages, business lines of credit, car loans, and more tied to Treasury yields, the prime rate, or other benchmarks. Real interest rates might still be negative, but higher rates will reduce liquidity, and push over leveraged borrowers, of which we have many, into default.
Strangely, the inflation the Fed is trying to fight wasn’t caused by them, and their tools are insufficient to fight it. Yes, the Fed’s Quantitative Easing had an impact on asset inflation, and especially the stock market. QE has been a massive stimulus program for Wall Street, and the stock market, but it did absolutely nothing for the bottom 65% of Americans.
Quantitative Easing changed almost nothing but asset prices in the financial markets, and low interest rates on car loans and mortgages. And yes, those low interest rates have reduced our debt service costs, which has freed up more cash, which has also added to demand. And, all of that is on the Fed.
But, actual inflation? I’m sorry, but that’s all on Congress, and the “helicopter money” they showered on our citizens. The Fed can accommodate Congress by buying the government’s debt, but it shows right back up on their balance sheet. The point is, it’s not “hot money.” The multiple stimulus packages passed by Congress were “hot money” on steroids. It went straight into the hands of people who, how dare they, actually spent it. And, since they couldn’t spend their “helicopter money” at restaurants, hotels, and travel, they bought “stuff!” So much “stuff” we had demand shock. Consumers wanted more than businesses could or have produce.
But, hold the phone, there’s still more. COVID had a very serious impact on supply, too. When employees can’t come to work, shortages start to build up very quickly. Think chips for example. Additionally, businesses were facing wage inflation, and higher costs for their raw materials, or components. So, they raised prices, sometimes because it was justified, and sometimes simply because they could. It’s interesting to note, profit margins for the largest companies in the US are at all-time highs.
Cummins Diesel said they will be dealing with chip shortages two more years. Cummins buys run-of-the-mill, low-end chips. Chip fabricators do not want to build a factory to manufacture low-end chips when the demand for those chips will not be there two, or three years from now. They want to see 10-year horizons. I suspect it’s exactly the same for multiple businesses all across the spectrum. Businesses see an initial demand created by the massive stimulus from Congress, supply chain disruptions caused by COVID, and realize things will probably settle out, and building another production line today will not be useful when demand evens out two years from now. It’s just going to take us some time to sort through the demand and supply shocks. And, there’s not a swinging thing the Fed can do with their policy tools to fix the root cause of inflation created by our Congress with all their stimulus.
To be clearer, I am by no means saying the Fed should be let off the hook. The Fed’s Treasury bond purchases, and interest rate manipulations did facilitate excess spending. Similarly, their mortgage security purchases did propel the housing boom, which is adding to inflation. It is a very good thing the Fed is now slowing the pace of their purchase, but personally they probably should have done it a year ago.
I suspect price inflation will continue until the supply chain catches up with demand, or fiscal and monetary policies tighten enough to reduce demand. We all want more, and thanks to MP1, MP2, and MP3, most of us can afford more. And, we’ll continue to party before the punchbowl runs dry, but run dry it will, for a reason no one can control. Enter labor force participation.
Our country’s Labor Force Participation, not unemployment, is the big concern. Because, no one can control it. After rising for decades, our labor force participation rate peaked at 67.3% in January 2000, and is currently 62.3%.
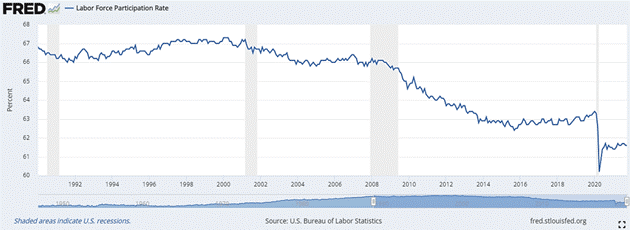
As we progress through the decade of 2020, the decline in our country’s labor participation rate is going to accelerate. The driver… the large population of aging Baby Boomers. Between the ages of 65 and 74 the Labor Force Participation rate is around 30%, but at age 75 it drops to 10%. Last year, 2021, the large 1946 born contingent of Boomers hit 75. Now, for every year going forward this large horde of workers will be leaving the workforce.
“Where did all the workers go” is a recurring question I keep hearing. Why did everyone leave the works force and not come back during the COVID era? With this chart, I can partially answer the question.
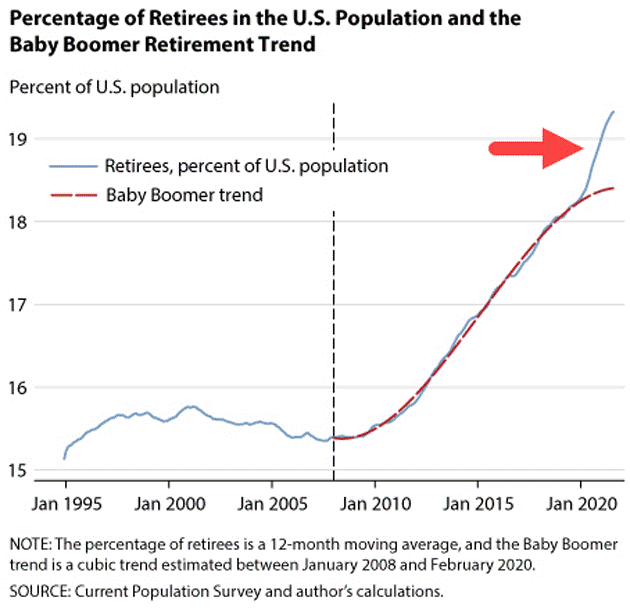
The blue line shows retirees as a percentage of the US population. As you would expect, it turned higher after the first Baby Boomers turned 65 in 2010. The red line is merely a smoothed trend for the period post 2010.
Then came 2020, and we see by the red arrow a sharp jump in the percentage of retirees above the previous decade’s trend. I would submit to you this jump in retirees wasn’t health, or death related. Thanks to the monetary policies of the past 14 years, I suspect a very large percentage of these retirees saw big gains in their portfolios as the stock market surged, and decided they could retire earlier than they had previously planned.
On this chart the percentage may look small, but this divergence represent something like 3 million “excess retirees” above what the prior trend predicted. That represents very significant shrinkage in our labor force in just a single year.
Couple it with the Boomer generation, who once blasted hiring managers with hundreds of resumes for every opening, are now leaving the workforce, one way or another. And, unfortunately, subsequent generations are smaller, because birth rates and immigration fell. Add in the effects of COVID, and we now have a severe labor shortage.
I don’t believe we’ve processed how profound this change is going to be. Because workers are scarce relative to demand for their services, they have more influence. They can demand, and receive higher wages. This is clearly inflationary.
At the very same time we’re awash in available investment capital, which greatly exceeds the demand. This is one reason interest rates have been persistently low. If you want to earn interest income by lending your capital, you are competing with many others who want to do the same. Borrowers will naturally choose the best terms, and so it’s a race to the bottom.
Bottom line, I believe we are shifting from a capital-constrained economy to a labor-constrained economy, and I don’t think this will be temporary. Naturally, we’ll see ebbs and flows, but this is generally the way it’s going to be for a while. I know I’m spending little, to almost no time looking for capital, but I am spending a lot of time finding finding human capital. And, I don’t believe I’m the only CEO experiencing this. The tech world has been dealing with this for some time. Now, it’s becoming the norm for every sector.
Now, let’s discuss the stock market for a minute. I think this chart speaks volumes about about the effects of MP3. This chart shows year-over-year money flows into equities.
You can’t help but notice the recent change. Cash inflows into equites for the past year exceeds all the inflows of the prior 19 years combined! Needless to say, this is not normal. And, all this incoming cash raised valuations.
Let’s look at Crestmont Research’s Real Price to Earnings chart for the S&P 500. I prefer the Crestmont P/E ratio to the standard P/E ratio, because it’s based upon the historical relationship between earnings per share and gross domestic product. This chart covers the time period 1871 through February 2022.
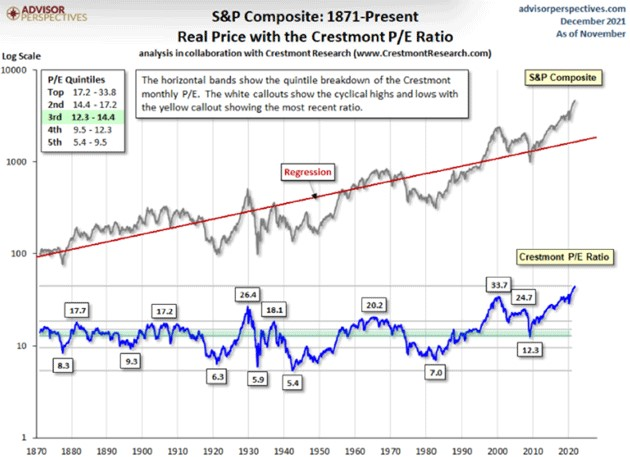
The Crestmont Price to Earnings ratio of 38.9 at the end of February 2022, was 164% above its average, and at the 99th percentile of this 14 plus decade series. Our current rally started in early 2014, but notice the two months in 1929, the tech bubble of 2000, and the end of February 2022. All three had Price to Earnings ratios above 25.
You don’t have to be a rocket scientist to know both inflation, and deflation are not good for stock investments. Historically, the “sweet spot” has been when inflation was between zero and 3%, and at much lower valuations. Depending on how you measure standard deviation, we are currently 4 standard deviations from the mean, which is higher than the Roaring 20s, and the tech bubble of 2000. By the way, a standard deviation of 4.0 would occur once every 31,560 days, or about 1 trading day every 126 years.
All of this suggests one of two things needs to happen. Either inflations needs to drop, or the stock market needs to drop, or some combination of the two.
This will probably be a different investing environment than most of us have ever known, because as investors, we won’t be in the driver’s seat anymore. Companies who need debt or equity financing will have many options. As investors, we will have to give them a reason to choose us, which will boil down to price and yield.
I believe the large funds will have even greater problems. And, currently underfunded Pension Funds are having to invest in overvalued markets, which will swing to undervalued at some point, possibly right as those plans need cash to pay benefits. Folks who are counting on one of these many underfunded plans for their long retirement may want to start making alternative plans.
Now, I’m sure the question you are waiting for me to go out on a limb and answer is: Are we going to have a bear market? And, my answer is certainly. But, like you, I’m not sure when. However, I would like to make two points.
First, the total return of the S&P 500 has been 10.5% per annum since its inception in 1957. There have been 26 bear markets since 9/7/1929. The longest bear market lasted 630 days starting 1/12/1973, and the shortest bear market lasted 33 day starting 2/19/2020, with the average bear market lasting only 289 days. My point here is, with bear markets averaging only 289 days, it’s easy to see why many an investor have underperformed the market by trying to time the market.
Secondly, we may already have a bear market occurring within the S&P 500, and please allow me to explain. While the S&P 500 is made up of 500 companies, 8 companies, which I’ll refer to as the “MegaCap-8,” account for 50% of the total market capitalization of the S&P 500. Think about that for a minute. 8 companies, not 250 companies, account for half the total value of the S&P 500. In fact, since 2012, those 8 companies produced a total return 5.6 times greater for their shareholders than the other 492 companies combined produced for their shareholders. If you’re curious, those 8 companies are:
1. Alphabet (Google)
2. Amazon
3. Apple
4. Meta (Facebook)
5. Microsoft
6. Netflix
7. NVIDIA
8. Tesla
As of March 4th, 2022 those 8 stock’s sported a Price to Earnings ratio 66% higher than the Price to Earnings ratio of the other 492 companies combined. Long story short, significant portions of the market are already in bear market territory, but the S&P 500 is still being held up by the “MegaCap-8.” This is one of those times “friends don’t let friends buy index funds.” This isn’t a normal business or credit cycle. This is truly a unique economic environment, and I suspect a rifle will outperform a shotgun when it comes to stock returns for the balance of the 2020s.
And with that, I’m going to end this video here. Thank you for watching and if you’re still in need of a sleep aid, please watch the third video in this series for some conclusions to all the groundwork laid in these first two videos.
Thank you for watching, and I wish you all the best!